Over 335+ free slot games now available • Updated May 2026
Real Money Slots
No Download • No Registration
Play free slot machines online instantly! No download needed, no registration required. Choose from 335+ free slot games including Vegas classics, fruit machines, Megaways, and progressive jackpots. Perfect for fun or practice before playing real money slots.
335+
Games
95.91%
Avg RTP
29+
Providers
Best Online Slots
Select a slot to see details and play instantly

Free Slot Machine Games
No download • No registration • 335+ games
97.34%
Top RTP
300,000x
Max Win
0
Favorites
11/335
Showing
Browse Free Slots by Category
Find your perfect free slot game - no download, no registration
Slots by Theme
Explore 17+ themes - from Egyptian adventures to Vegas classics
Popular Free Slots 2026
Popular free slots right now

 #2
#2Fatz's Diner GigaBlox
Yggdrasil Gaming
 #3
#3Space Donkey
Nolimit City
 #4
#4Love is in the Fair
Play'n GO
 #5
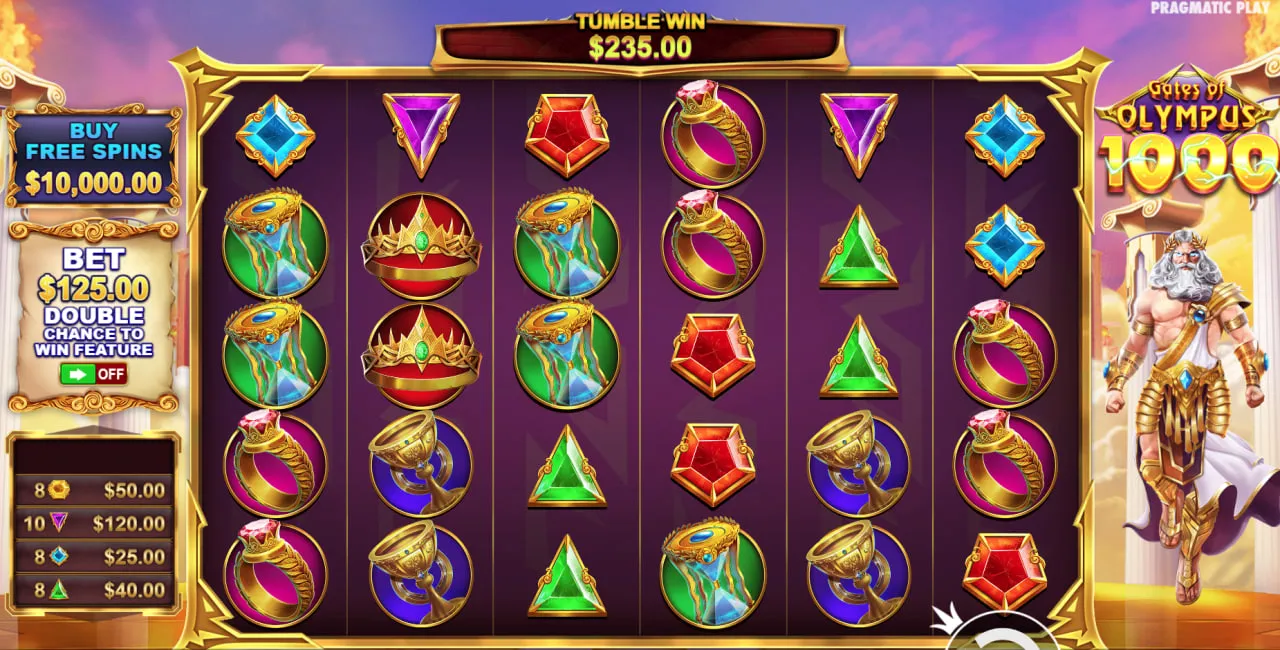
#5Gates of Olympus 1000
Pragmatic Play
 #6
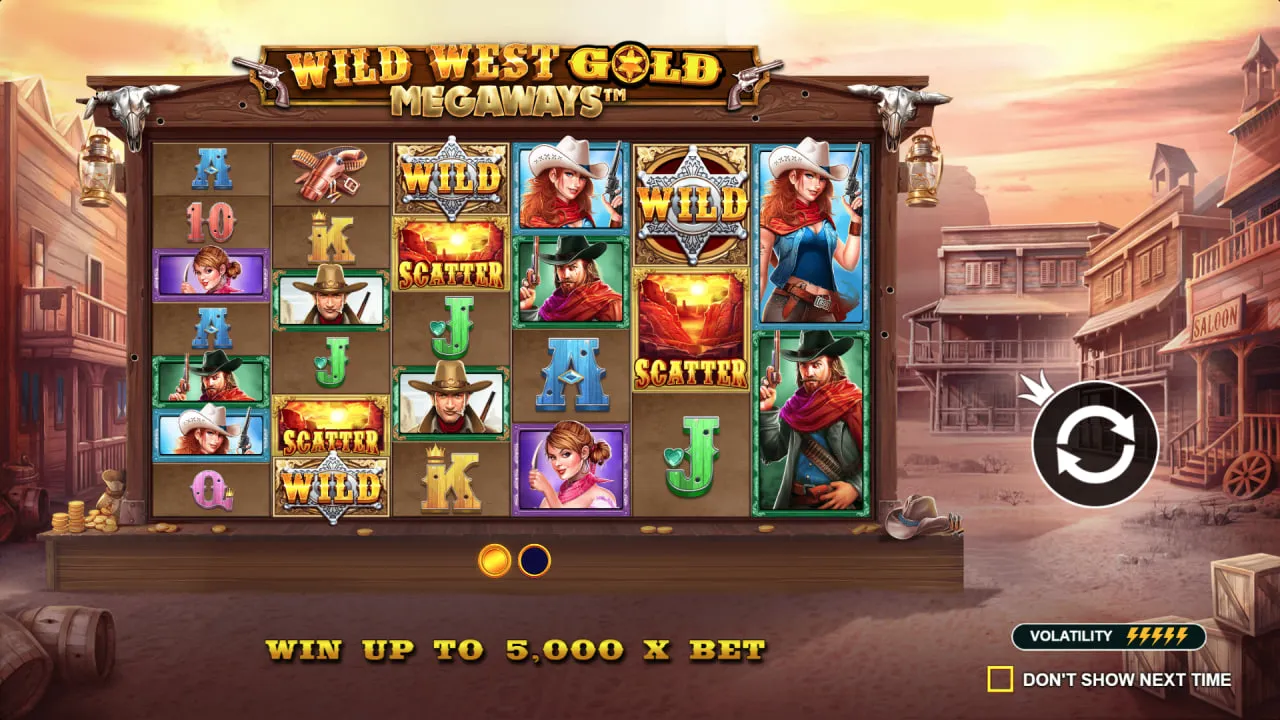
#6Wild West Gold Megaways
Pragmatic Play
 #7
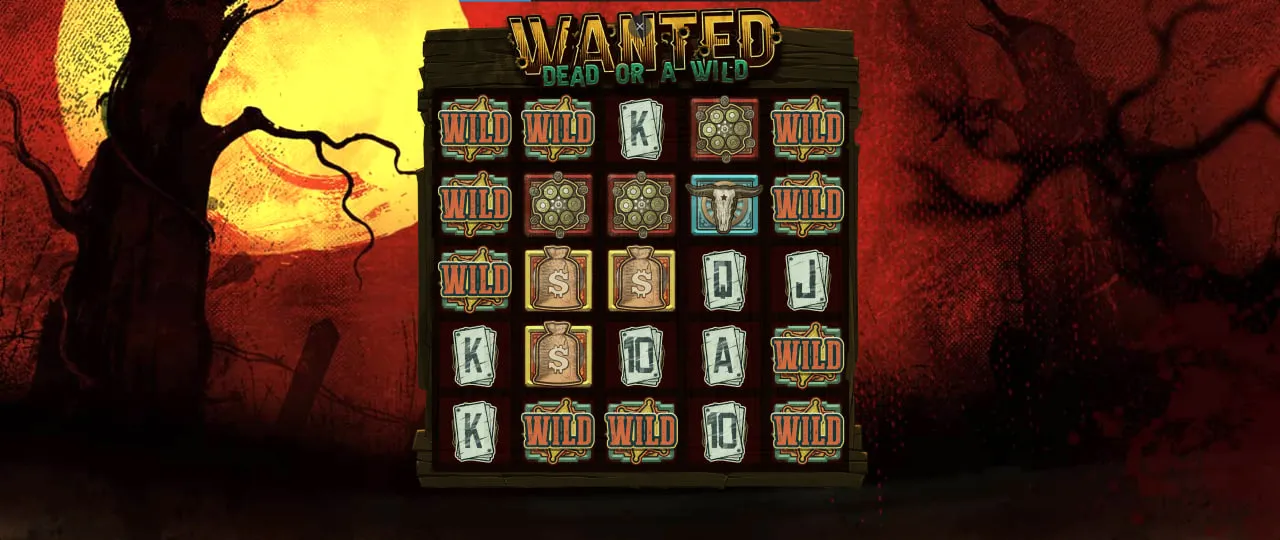
#7Wanted Dead or a Wild
Hacksaw Gaming
 #8
#8Honey Rush 100
Play'n GO
View All
Most Played
Free Slots by Provider
Play free demo games from 8+ top slot developers
Why Play Free Slot Games?
Discover the benefits of playing free slot machines online
100% Free, Forever
Our free slots will always be free. No hidden fees, no paywalls, no subscription required. Just pure entertainment whenever you want it.
- No Credit Card
- No Deposits
- Unlimited Play
Zero Financial Risk
Play with virtual credits. No deposits, no losses, no credit card needed. Pure entertainment without any financial commitment.
Learn Game Mechanics
Understand paylines, bonus features, and volatility before betting real money. Master any slot at your own pace.
Unlimited Free Play
No time limits, no session caps. Play as long as you want, whenever you want. Refresh to reset your balance instantly.
Play Anywhere
Desktop, tablet, or mobile - our free slots work everywhere. No app required, just open your browser and play.
Complete Privacy
No registration, no email, no personal data. Play anonymously without sharing any information.
Instant Access
No downloads, no waiting. Click and play instantly in your browser with our HTML5 slot games.
How to Play Free Slots
Get started in seconds - no download, no signup, just fun!
Choose a Slot
Browse our collection of 10,000+ free slot games. Use filters to find games by theme, provider, volatility, or RTP.
Start with popular slots like Gates of Olympus or Sweet BonanzaClick Play Demo
Click the "Play Free" button - no download needed, no registration required. The game loads instantly in your browser.
Works on desktop, tablet, and mobile devicesSet Your Bet
Adjust your virtual bet size using the controls. Demo credits are unlimited - refresh the page to reset your balance.
Try different bet sizes to see how volatility affects gameplay
Spin & Play
Hit the spin button and watch the reels! All features work exactly like real money mode - free spins, bonuses, multipliers.
Use autoplay to test how often bonus features triggerReset Anytime
Run out of demo credits? Simply refresh the page! Your balance resets instantly. Play as long as you want.
Unlimited free plays - perfect for testing strategiesFind Your Favorites
Discover which slots you enjoy most before committing real money. Save favorites and compare different games.
High RTP slots (96%+) give longer play sessions
That's It - You're Ready!
No credit card, no account needed. Just pick a slot and start playing!
Free Slots Tips & Guides
Learn how to get the most from your free slot experience
- Guide8 min read
Beginner's Guide to Free Slots
Everything you need to know about playing free slot machines online. From choosing games to understanding features.
RTP & Volatility Explained
Strategy•6 min readMastering Slot Bonus Features
Features•7 min readHow to Pick the Best Free Slots
Tips•5 min readFree Slots on Mobile
Mobile•4 min readView All Guides
6 articles available
Slot Terms Glossary
Essential terms every slot player should know
| Term | Icon | Alt Name | Definition |
|---|---|---|---|
| RTP | Return to Player | Percentage of wagered money returned to players over time. 96%+ is good. | |
| Volatility | Variance | How often a slot pays. Low = frequent small wins, High = rare big wins. | |
| Paylines | Win Lines | Lines where matching symbols create wins. Classic: 1-5, Modern: 20-100+. | |
| Wild | Wild Symbol | Substitutes for other symbols to complete winning combinations. | |
| Scatter | Scatter Symbol | Triggers bonus features regardless of position. Usually activates free spins. | |
| Free Spins | Bonus Rounds | Spin for free while keeping winnings. Often with multipliers. | |
| Multiplier | Win Boost | Multiplies your winnings. 5x multiplier turns $10 win into $50. | |
| Max Win | Top Prize | Maximum possible win per spin, shown as bet multiplier (e.g., 5000x). | |
| Megaways | Dynamic Reels | Up to 117,649 ways to win with changing reel sizes each spin. | |
| Bonus Buy | Feature Buy | Pay extra (e.g., 100x bet) to instantly trigger the bonus round. |
Free Slots by the Numbers
Impressive stats about our free slot collection
- 335+
- Free Slot Games
- 29+
- Game Providers
- 95.91%
- Average RTP
- 300K×
- Max Win Potential
- 100%
- Mobile Compatible
- 24/7
- Availability
Did You Know?
- Over 500 new free slots added every month
- Players from 180+ countries enjoy free slots daily
- Gates of Olympus is the most played free slot of 2025
- Megaways slots offer up to 117,649 ways to win
- Millions of free spins played every single day
- Average session length: 23 minutes of free play
- Instant Play
- Works on All Devices
- Unlimited Free Spins
- Available Worldwide
Free Slots on Mobile
Play on iPhone, Android, tablet - no app download required
Tap to Play
No download required
100%
Compatible
HTML5
Technology
6+
Devices
Mobile-First Gaming
Every slot game is optimized for touch screens. Experience smooth gameplay with intuitive controls designed for mobile devices.
- Touch Optimized
Intuitive touch controls
- Full Screen
Immersive gameplay
- Low Data
Works on slow connections
- Battery Saver
Play longer sessions
Supported Platforms
- iPhone
- iPad
- Android Phone
- Android Tablet
- Laptop
- Desktop
- Rotate phone for landscape mode
- Use full screen for immersion
- Connect to WiFi for best quality
- Add to home screen for quick access
Free Slots vs Real Money Slots
Understand the differences before you play
6
Free Slots Wins
3
Real Money Wins
3
Tied
| Feature | Free Slots | Real Money | Best |
|---|---|---|---|
| Cost to Play | Completely Free | Real Money Required | |
| Registration | Not Required | Account Required | |
| Download | No Download | Sometimes Required | |
| Game Features | All Features Work | All Features Work | |
| Graphics & Sound | Identical | Identical | |
| RTP & Volatility | Same as Real | Same as Demo | |
| Win Real Money | No | Yes | |
| Jackpots | Demo Only | Real Prizes | |
| Bonuses | Not Available | Casino Bonuses | |
| Financial Risk | Zero Risk | Can Lose Money | |
| Practice Value | Excellent | Limited | |
| Availability | 24/7 Unlimited | Depends on Balance |
Free Slots Are Best For:
Risk-Free Gaming- Learning how slots work
- Testing new games before betting
- Understanding bonus features
- Finding your favorite themes
- Pure entertainment without stress
- Practicing bankroll strategies
Real Money Is Best For:
Win Real Prizes- Winning actual cash prizes
- Playing progressive jackpots
- Claiming casino bonuses
- The thrill of real stakes
- Loyalty rewards & VIP perks
- Withdrawable winnings
Our Recommendation
Start with free slots to learn the games and find what you enjoy. When you're ready and can afford to lose, try real money slots at a licensed casino with a welcome bonus. Always gamble responsibly and set strict limits.
Casinos with Free Play Mode
Play demos for free, then switch to real money when ready
BC.Game
Return to Player
96.2%
Bets.io
Return to Player
96.1%
BitStarz
Return to Player
96.4%

Metaspins
Return to Player
96%
Free Slots FAQ
Common questions about playing free slot machines
Can I play free slots without downloading anything?
Yes! All our free slot games run directly in your web browser using HTML5 technology. No download, no installation, no app required. Simply click 'Play Demo' on any slot and start spinning instantly. Works on desktop, tablet, and mobile devices.
Do I need to register to play free slots?
No registration required! You can play all demo slots anonymously without creating an account. We believe free slots should be truly free - no email, no sign-up, no personal information needed. Just pick a game and play.
Are free slots the same as real money slots?
Yes, our free demo slots are identical to their real money versions. Same graphics, same features, same RTP, same volatility. The only difference is you're playing with virtual credits instead of real money. It's the perfect way to test games before playing for real.
Can I win real money playing free slots?
Free slots use virtual credits, so winnings aren't real money. However, they're perfect for practicing strategies, understanding game mechanics, and finding your favorite games. When you're ready to win real money, you can play the same games at licensed online casinos.
What are the best free slots to play?
Popular free slots include Gates of Olympus, Sweet Bonanza, Big Bass Bonanza, and Book of Dead. For beginners, we recommend starting with low-medium volatility slots like Starburst or Gonzo's Quest. High RTP slots (96%+) give you longer play sessions with your virtual credits.
Do free slots have bonus features and free spins?
Absolutely! All bonus features work in demo mode - free spins, multipliers, bonus rounds, Megaways mechanics, and even bonus buy options. You can experience every feature without spending a penny. It's the best way to understand how bonus rounds trigger.
Can I play free slots on my phone?
Yes! All our free slots are mobile-optimized and work on iPhone, Android, and tablets. No app download needed - just open in your mobile browser and play. Touch controls are intuitive, and games automatically adjust to your screen size.
Are free slot games safe?
Our free slots are 100% safe. No real money transactions, no personal data required, no downloads that could contain malware. All games come from licensed providers like Pragmatic Play, NetEnt, and Play'n GO who use certified Random Number Generators.
Why do casinos offer free slots?
Free slots let players try games risk-free before depositing. It builds trust and helps players find games they enjoy. For players, it's a win-win: you get unlimited free entertainment and can make informed decisions if you ever decide to play for real money.
How do I get more free credits when I run out?
Simply refresh the page! Demo slots reset your virtual balance automatically. Most games start you with 1,000-10,000 free credits. You can play as long as you want with unlimited refreshes - there's no limit to free play.
What is a slot machine simulator?
A slot machine simulator is another term for free demo slots. These simulators replicate real casino slot machines exactly but use virtual credits. They're perfect for entertainment, practice, and understanding how different slot mechanics work without any financial risk.
Can I play classic Vegas-style slots for free?
Yes! We have hundreds of classic 3-reel fruit machines, 777 slots, and Vegas-style games. Popular classics include Double Diamond, Triple Red Hot 777, and Buffalo. These capture the authentic casino floor experience with simpler gameplay.
Play Responsibly
Free slots are a great way to enjoy casino games without financial risk. However, if you ever choose to play for real money, always gamble responsibly. Set limits, take breaks, and never chase losses. Gaming should be entertainment, not a source of income.
- 21+ Only
- 1-800-GAMBLER
- Free Play
- No Real Money